Deviation of runoff Volume
The deviation of runoff volumes (Dv), also referred to as the percentage bias, serves as a fundamental measure of goodness-of-fit for hydrological models. This metric, defined by the World Meteorological Organization (WMO) in 1986, offers a straightforward yet effective means of assessing the model's performance.
Dv quantifies the disparity between modeled and observed runoff volumes, providing insights into the model's accuracy in reproducing real-world hydrological processes. Ideally, a perfect model would yield a Dv value of zero, indicating precise agreement between modeled and observed runoff volumes.
A smaller Dv value corresponds to superior model performance, as it signifies closer alignment between model predictions and actual observations. This metric, as highlighted by Gupta et al. in 1999, offers a clear and intuitive assessment of model accuracy.
One of the key advantages of Dv is its simplicity and universality. Unlike some other goodness-of-fit criteria, Dv does not require separate formulations for different time scales or averaging periods. This streamlined approach facilitates straightforward comparisons and evaluations, making Dv a versatile tool for assessing model performance across various hydrological contexts.
In summary, the deviation of runoff volumes (Dv) provides a concise and reliable measure of model accuracy, offering hydrologists a valuable tool for evaluating and comparing different modeling approaches.
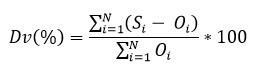
where O is the observation value and S is the forecast value.
How To Cite
Please provide the data in a two-column format (observed vs. simulated). You can copy from Excel, text, or any other format, separated by space.
Deviation of runoff Volume: %