Pearson coefficient
The Pearson correlation coefficient, often denoted as r, is a statistical measure used to assess the strength and direction of the linear relationship between two continuous variables. It's widely regarded as one of the most effective methods for quantifying the association between variables due to its basis in covariance analysis.
The coefficient ranges between -1 and 1, inclusive, where:
r = 1 indicates a perfect positive linear relationship, implying that as one variable increases, the other variable also increases in a linear fashion.
r = −1 indicates a perfect negative linear relationship, suggesting that as one variable increases, the other variable decreases in a linear fashion.
r = 0 indicates no linear relationship between the variables.
The formula for calculating Pearson's correlation coefficient r is as follows:
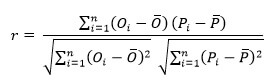
In the context of Pearson calculation, Oi represents the observation value, Pi denotes the forecast value, \( \bar{O} \) signifies the average of observation values, and P denotes the average of forecast values.
The Pearson correlation coefficient provides valuable insights into the relationship between variables:
A positive r value suggests a positive association, meaning that as one variable increases, the other tends to increase as well.
A negative r value indicates a negative association, implying that as one variable increases, the other tends to decrease.
The magnitude of r indicates the strength of the relationship. Values closer to -1 or 1 imply a stronger linear relationship, while values closer to 0 suggest a weaker association.
The direction of the relationship is determined by the sign of r, with positive values indicating a positive correlation and negative values indicating a negative correlation.
However, it's important to note that Pearson's correlation coefficient measures only linear relationships and may not capture nonlinear associations between variables. Additionally, correlation does not imply causation, meaning that even strong correlations do not necessarily indicate a causal relationship between the variables. Therefore, while Pearson's correlation coefficient is a powerful tool for assessing associations, it should be interpreted with caution and in conjunction with other statistical measures and domain knowledge.
How To Cite
Please provide the data in a two-column format (observed vs. simulated). You can copy from Excel, text, or any other format, separated by space.