R2 (R-squared correlation)
R-squared correlation, also known as the coefficient of determination (R^2), is a crucial statistical metric used in regression analysis. It serves as a measure of the proportion of the variance or difference in the dependent variable that can be explained by one or more independent variables included in the regression model. In essence, R-squared indicates how well the regression model fits the observed data or how effectively it captures the variability of the dependent variable.
When interpreting R-squared, it's essential to understand that it ranges between 0 and 1. A value of 0 implies that the regression model fails to explain any variability in the dependent variable, while a value of 1 indicates that the model perfectly explains all variability. Therefore, higher values of R-squared signify a better fit of the model to the data.
To compute R-squared, one typically begins by calculating the Pearson correlation coefficient (R) between the observed and predicted values. This correlation coefficient measures the strength and direction of the linear relationship between the variables. Subsequently, R-squared is obtained by squaring the correlation coefficient. This transformation allows for the representation of the proportion of explained variance as a percentage, facilitating easier interpretation.
It's important to note that R-squared alone does not provide a complete picture of the model's performance. While a high R-squared value indicates a good fit of the model to the data, it does not necessarily imply causation or the absence of omitted variables. Therefore, it's crucial to supplement R-squared with other diagnostic measures and consider the context of the regression analysis when drawing conclusions about the model's effectiveness.
In summary, R-squared correlation serves as a valuable tool for assessing the goodness of fit of regression models and understanding the extent to which independent variables explain the variability in the dependent variable. By quantifying the proportion of explained variance, R-squared enables researchers and analysts to evaluate the predictive power and reliability of regression models in explaining real-world phenomena.
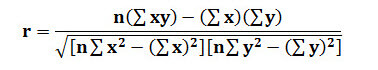
- r = Pearson correlation
- n = number in the given dataset
- x = first variable in the context (or observation data)
- y = second variable (or modeled data)
How To Cite
Please provide the data in a two-column format (observed vs. simulated). You can copy from Excel, text, or any other format, separated by space.
R-squared correlation (R2):