Bernoulli Distribution Fitting
In the realm of probability theory and statistics, the Bernoulli distribution stands as a foundational concept, named in honor of the Swiss mathematician Jacob Bernoulli. This distribution characterizes the discrete probability of a random variable, which assumes the value of 1 with a likelihood denoted as p, and the value of 0 with the complementary probability, q = 1 - p.
To understand it more intuitively, envision a scenario where a single experiment poses a binary question, eliciting a yes or no response. The Bernoulli distribution provides a framework for modeling such outcomes. These yes-no inquiries yield results that can be represented by a Boolean variable: a single bit of information that holds a value of success, yes, true, or one with a probability of p, and failure, no, false, or zero with a probability of q.
One common illustration of this distribution lies in its application to coin tosses. Imagine tossing a coin?biased or unbiased?where the outcomes are conventionally labeled as "heads" and "tails." Here, the Bernoulli distribution offers a means to quantify the probabilities associated with these outcomes. If p represents the probability of the coin landing on heads, then 1 would signify a head, while 0 would signify a tail. In cases of biased coins, where the probabilities of heads and tails are unequal, p deviates from the standard 1/2.
In summary, the Bernoulli distribution serves as a fundamental tool in modeling binary events, encapsulating the essence of probability in scenarios where outcomes are dichotomous. Whether applied to coin flips or other yes-no inquiries, its simplicity and versatility render it indispensable in various statistical analyses and decision-making contexts.
The binomial distribution is the discrete probability distribution of the number of
successes in a sequence of >n independent yes/no experiments, each of which
yields success with probability p. Such a success/failure experiment is also
called a Bernoulli experiment or Bernoulli trial; when n = 1, the binomial
distribution is a Bernoulli distribution.
References:
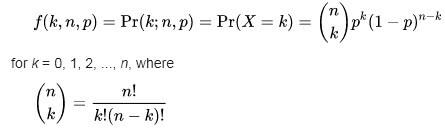
Where:
-
p is the success probability for each trial
-
q is the failure probability for each trial
-
f(k,n,p) is probability of k successes in n trials when the success probability is p
How To Cite
We used Accord.Statistics for this calculator